From the Reports Tab, you can view three types of Usage Report.

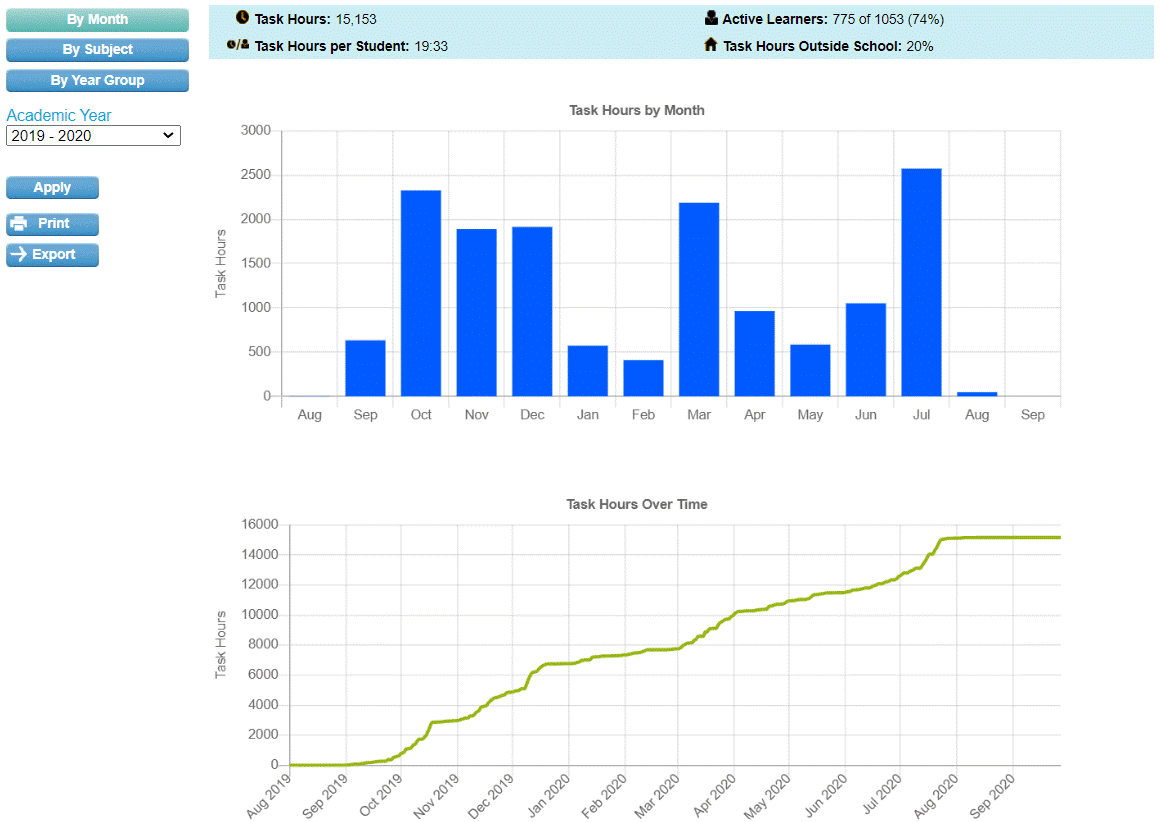
By Month
Understand your annual usage trends... e.g. in the run up to exams!

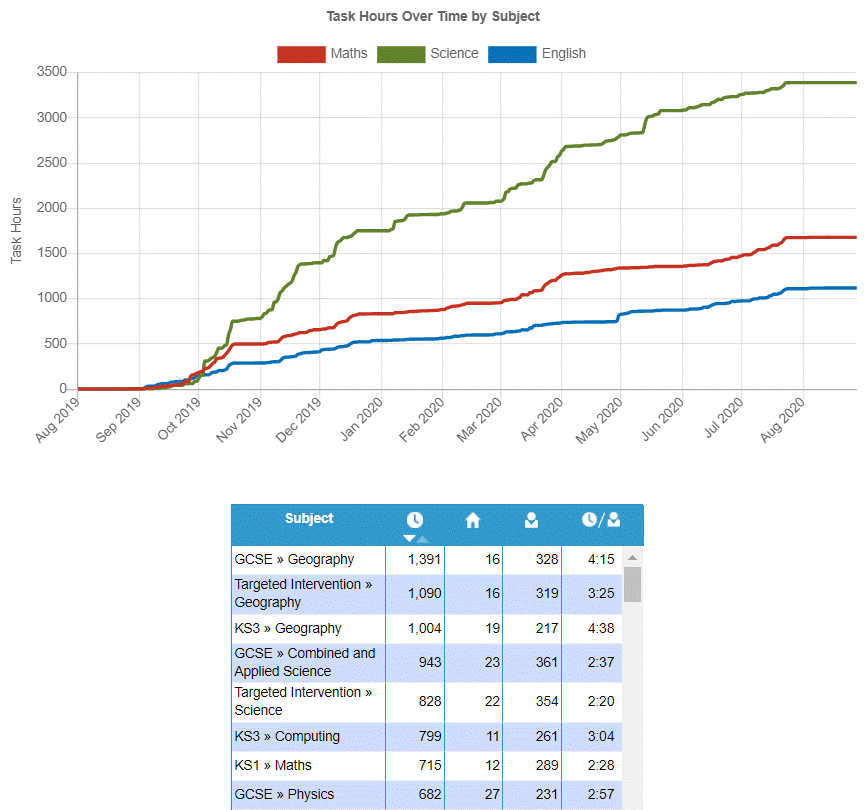
By Subject
The graph at the top shows how much usage you have got in core subjects.
The table underneath shows usage across subjects and Key Stages.

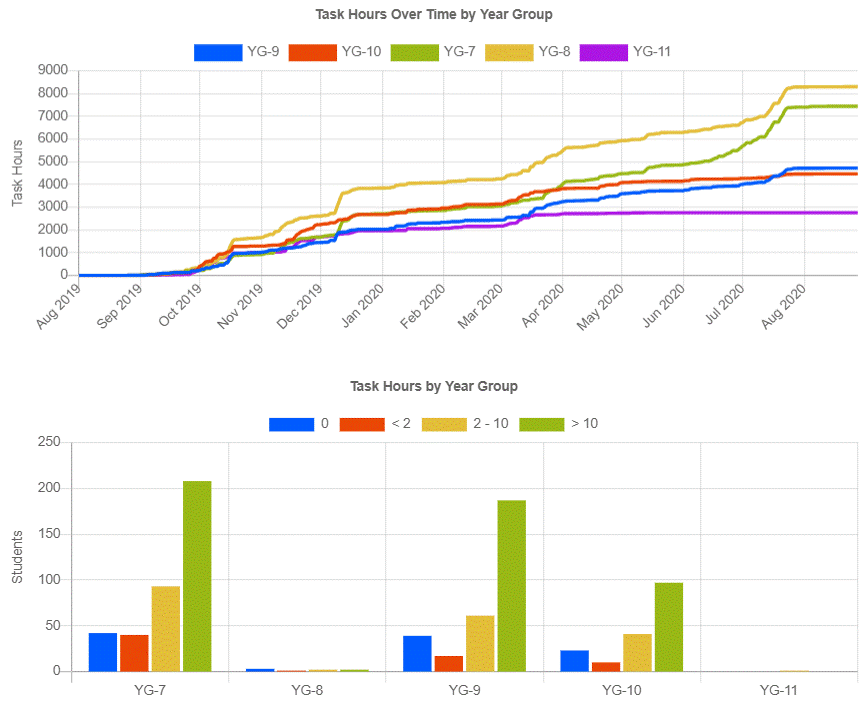
By Year Group
Compare usage across different year groups - and see how many of your learners are on track to beat the 10 Task-hour Challenge.


Comments
0 comments
Please sign in to leave a comment.